Original author: Ding HAN, UkuriaOC
Original source: Glassnode
executive Summary
Capital continues to flow into Bitcoin, with its market capitalization rising to a new high of $540 billion. The current rate of capital inflow into the asset has exceeded $79 billion per month.
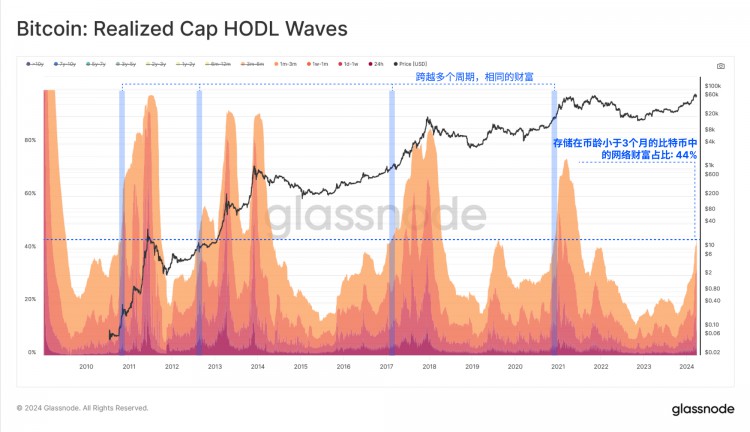
The transfer of wealth from long-term holders to new demanders is accelerating, and currently more than 44% of network wealth is owned by new coins with a coin age of no more than 3 months.
Profit-taking continues to dominate investor behavior, with both long-term and short-term holders reducing their holdings. However, the overall profit advantage is gradually shifting to long-term holders.
See all the charts from this report in this week’s on-chain dashboard.
The upward trend of liquidity
Bitcoin’s price action decisively broke above the previous cycle’s all-time high in early March, triggering a shift in price discovery. As we discussed last week (On-chain Weekly Week 13), this prompted a large amount of supply to be cashed out and profited.
This causes the sold bitcoins to be revalued, typically from a lower cost basis to a higher cost basis. As these bitcoins change hands, we can also view it as an injection of new demand and liquidity into the asset class.
This mechanism is elegantly expressed through the realized market capitalization metric, which tracks the cumulative USD liquidity “stored” in asset classes. Realized market capitalization has now reached a new all-time high of $540 billion and is growing at an unprecedented rate of more than $79 billion per month.
 Real-time charts We can break down the realized market capitalization for each age group using the realized market capitalization holdings volatility indicator. This tool is particularly useful for distinguishing the distribution of dollar-denominated wealth held by different age groups.
If we only consider coins held for 3 months or less, we can see a sharp increase in recent months, with these newer investors now owning approximately 44% of the total network wealth. This growth in young coins is a direct result of long-term holders selling their coins at higher prices to meet the influx of demand.
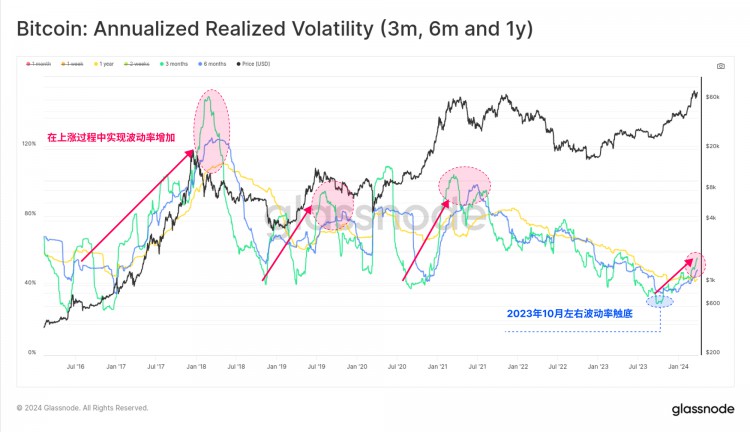
 Real-time chart In previous Bitcoin cycles, the increase in new demand is usually accompanied by a surge in speculative interest. This often leads to increased market volatility, which is a characteristic of macro uptrends in previous Bitcoin cycles.
90-day realized volatility has nearly doubled since October 2023, from 28% to 55%, a period that marked the beginning of an acceleration in realized market capitalization inflows.
 Real-time charts Silent supply recovery
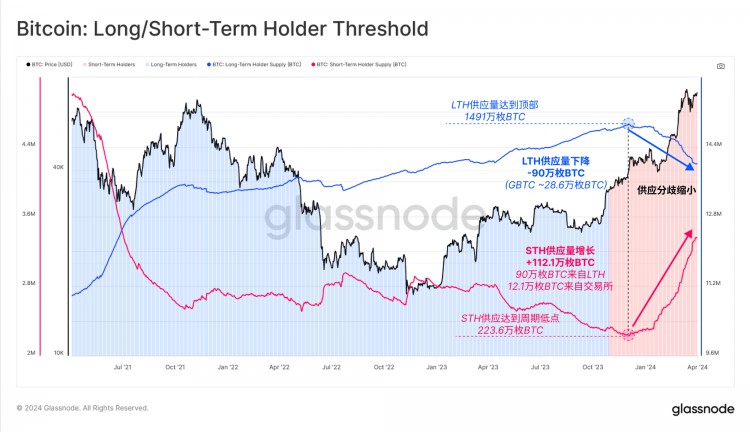
After a historic supply squeeze (see On-chain Weekly Report, Week 46, 2023), the difference in supply between long-term and short-term holders has begun to narrow. As prices rise, unrealized profits held by investors increase, which attracts long-term holders (LTHs) to sell their holdings.
Since reaching a peak of 1,491 full BTC in December 2023, the supply of long-term holders (LTH) has decreased by 900,000 BTC, of which GBTC Trust outflows account for about one-third of this number (about -286,000 BTC).
Conversely, short-term holders increased supply by +112.1k BTC, absorbing selling pressure from long-term holders and acquiring an additional 121k BTC from the secondary market via exchanges.
Note: The supply for short-term holders and long-term holders is shown here separately on different y-axes for easier visualization.
 Real-time workbench
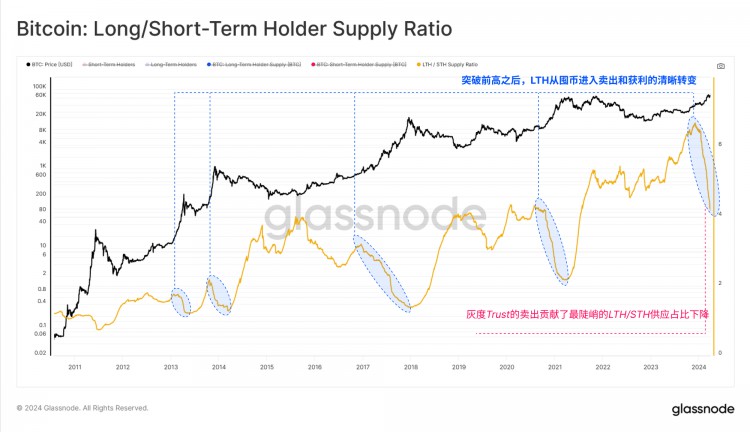
We can complement this observation by assessing the ratio between long-term and short-term holder supply. Again, the declines clearly visible in all macro uptrends are as the dominant investor behavior shifts from long-term holding to selling, profit taking, and speculation.
A key takeaway from these observations is the clear shift in investor behavior patterns when new market highs are reached. Selling pressure from long-term holders tends to accelerate at higher prices as new demand builds. While the new US ETF approvals are a significant new component of market structure, these trends are visible in on-chain data from all previous cycles.
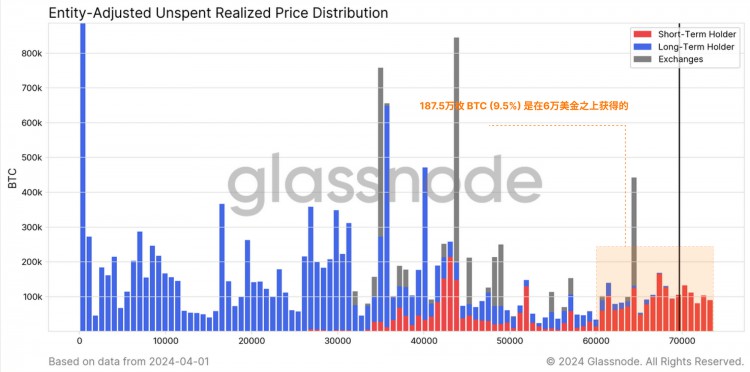
 The chart below from the real-time workbench breaks down BTC supply based on on-chain cost basis and long/short term holder groups.
We can see that approximately 1.875 million Bitcoins (9.5% of the circulating supply) have been acquired at prices above $60,000, with the majority of these being attributed to the short-term holder group . This would include new spot buyers, as well as the approximately 508,000 BTC currently held in US spot ETFs (excluding GBTC).
 Real-time Engine Room
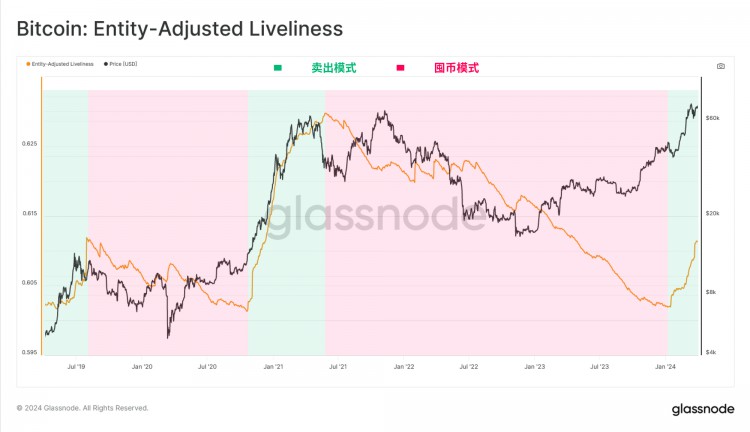
We can support the above observations with an activity metric, which describes the overall balance of “holding time” stored in the supply.
The continued rise in activity indicates that the long-term inactive and sold Bitcoins have generally exceeded the "holding time" accumulation of long-term held (HODL) Bitcoins. This reiterates the point that the market has shifted to a selling and profit-taking dominated mechanism.
 Tools for evaluating uptrends on real-time charts
Analyzing the market is always seeking a balance between supply and demand, and everything has two sides. For example, profit taking by long-term holders is both a measure of selling pressure and a judgment of new demand inflow from short-term holders.
Additionally, when the market is trading near or setting new highs, the Bitcoin that is realizing losses, especially from the short-term holder group, is clearly coming from buyers near the “local top”.
Related Dashboards: Many of the concepts explored in this section are related to our Bitcoin Bull Market Analysis Framework dashboard.
Against this backdrop, we can leverage several powerful on-chain metrics to compare the gains and losses of these two key but largely opposing market groups: long-term and short-term holders. We will use the following three metrics:
Realized Profit and Loss - refers to the total change in value of the Bitcoin sold from its original cost basis to the instant price at the time of the move.
Realized Profit/Loss Ratio - fluctuates around the equilibrium value of 1 in a logarithmic scale and is an ideal tool for spotting market turning points. For example, in an uptrend, realized losses accelerate exponentially, increasing from "not much" to "significant" (indicating that trapped local/global top buyers are starting to sell in panic).
Sell-side risk ratio - is the ratio between total realized profits + realized losses and realized capital. In other words, this indicator describes the ratio between the total movement of the currency value (the disturbance force) and the total size of the market (the object that is moved).
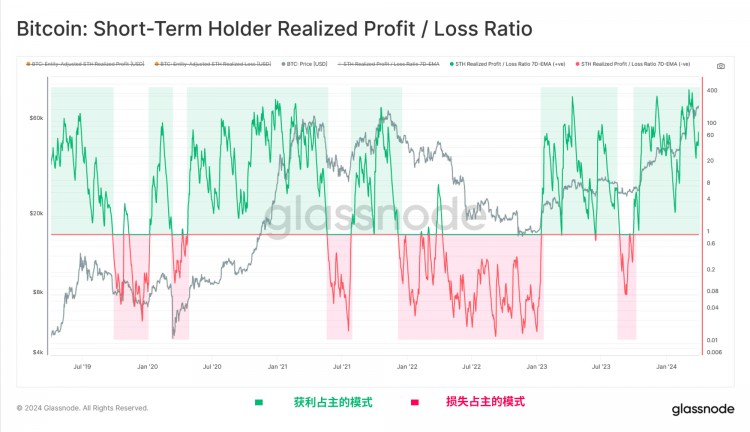
Starting with the short-term holders, we can see that their win-loss ratio is consistently in the profit-dominated territory, with wins outweighing losses by a factor of 50. Regular retests of the 1.0 equilibrium level suggest that profits are being absorbed and that investors are generally maintaining their cost basis during corrections.
 Real-time workbench
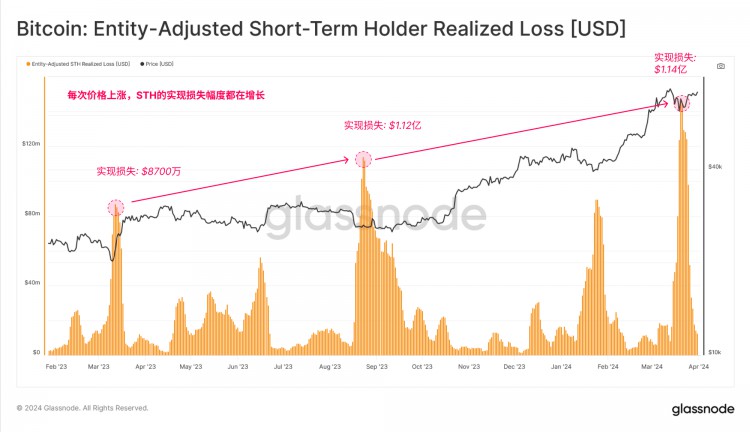
We can also see that during market downturns, STH realized losses surge as local top buyers panic sell out of fear that the market may fall further. The magnitude of realized losses also increases in each correction, indicating that the number and size of top buyers are growing in each upward round.
 Real-time charts
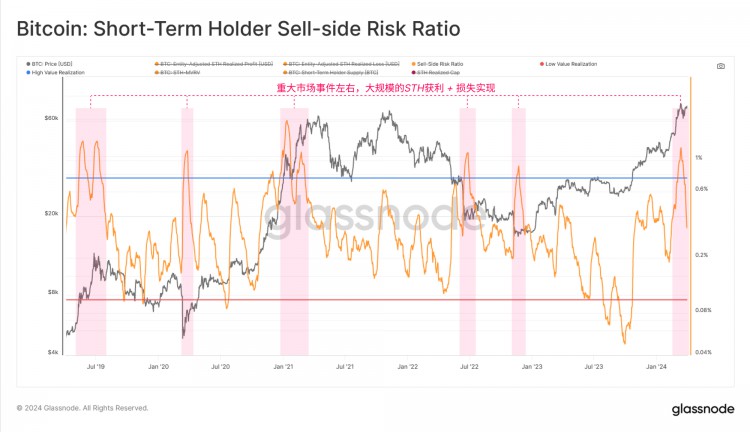
Next, we will evaluate STH's sell-side risk ratio to assess the relative size of its profit and loss events.
High values indicate that short-term holders are buying or selling cryptocurrencies at prices well above or well below their cost basis, meaning the market may need to re-balance (usually with wild price swings).
Low values indicate that most Bitcoin being sold is close to its breakeven cost basis, which suggests a degree of equilibrium has been reached and that the “breakeven” has been exhausted within the current price range (usually describing a low volatility environment).
After the price of Bitcoin exceeded $70,000, the selling risk ratio of short-term holders increased significantly, which usually occurs near market turning points (both overall and local). This usually indicates that a new equilibrium has not yet formed and the indicator is correcting sharply as the market adjusts and consolidates.
Analyst Tip: Sell-side risk ratios tend to behave similarly to realized volatility and option implied volatility, providing a measure of on-chain volatility.
 Live Workbench In our assessment of Long Term Holders (LTHs), we can see that their realized profit/loss ratio has risen exponentially and vertically. By definition, this is because there were no LTHs in the loss when the market just broke out of the previous cycle's high. This is further driven by the growth in profit taking by the aforementioned LTHs.
The real-time workbench is quite useful in tracking the realized losses of short-term holders during an uptrend, but it is more important to monitor the realized profits of long-term holders as this is a key component of selling pressure. To illustrate this, we can see that during the recent correction, LTH's realized losses have been reduced to only $3,500 per day compared to STH's $114 million.
Real-time charts
As profits realized by long-term holders accelerated, their sell-side risk ratio began to pick up, especially since October 2023. This indicator has grown nicely with the breakout of all-time highs, indicating that allocation pressure and profit-taking among the long-term holder group is similar to previous cycles on a relative basis.
Real-time workbench
Summary and Conclusion
Across various on-chain tools and indicators, we can see a clear shift in investor behavior patterns. Long-term holders have moved deep into their sell cycles, realized profits, and reawakened dormant supply to meet new demand at higher prices.
Using on-chain groups, we can also develop a set of tools and indicators to identify local and overall inflection points, especially using profit and loss indicators. The combination of LTH (long-term holders) and STH (short-term holders) groups, and their profit and loss behavior, provides us with a relatively unprecedented perspective on investor psychology, sentiment, and capital flows.


