The price of Bitcoin has been stuck in a consolidation phase over the past month, failing to continue its rally above $75,000. However, things could soon change.
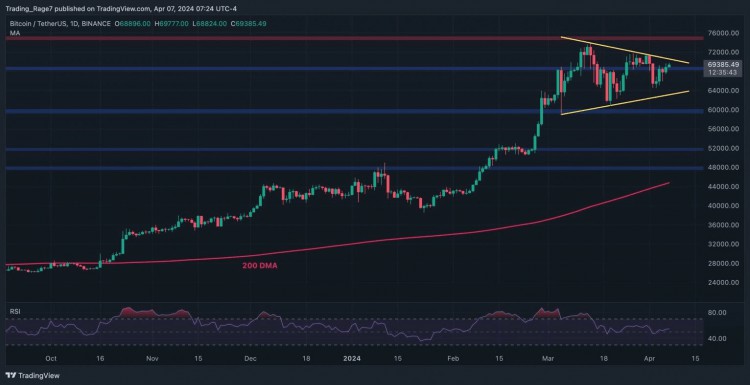
On the daily chart, the price has formed a large triangle pattern around the $70,000 mark. Depending on the direction of the potential breakout, these patterns could signal a reversal or a continuation of the trend.

Currently, the market has reclaimed the $70,000 level and is moving towards the higher borders of the pattern. If a bullish breakout occurs, the price is expected to rise and create new all-time highs in the short term.
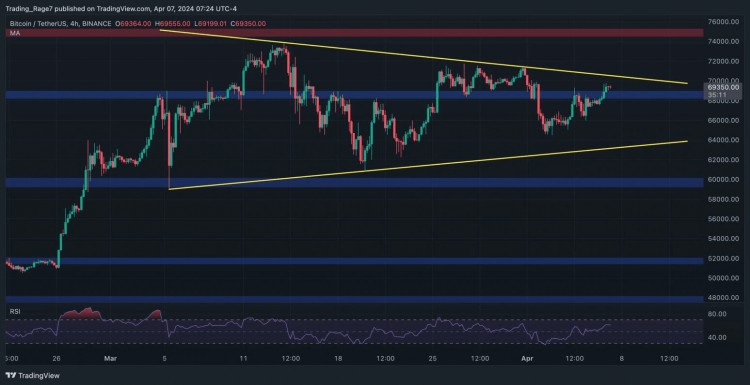
Looking at the 4-hour chart, it is clear that the price has rebounded from the $64K level and surpassed $68K. The market is approaching the upper border of the triangle pattern and its reaction to it will determine whether new all-time highs can be expected in the coming weeks or if more consolidation will follow.

The relative strength index is also showing values above 50% suggesting that the momentum is in favor of bullish continuation.
An important reason for the adjustment of the bull market cycle is the profit realization of market participants. After Bitcoin hit a record high, many investors sold some Bitcoin to realize profits.

This selling pressure was one of the main factors that halted the recent price rally.
The chart shows the Short-Term Holder Expenditure Profit Rate (SOPR), which measures the profit ratio realized by holders who have held tokens for less than 155 days.
As shown in the chart, the SOPR indicator rose sharply but quickly fell during the consolidation period. This sharp decline suggests that the profit realization phase is basically over and the market may be ready to start a new bullish wave.
