Will Dogecoin continue to break out of the bull flag pattern?
Dogecoin (DOGE) markets, describing a breakout rally, surged over 45%. Not only does this event signal a possible new macro uptrend for Dogecoin, but it also suggests that this trend may continue after a bull flag breakout.
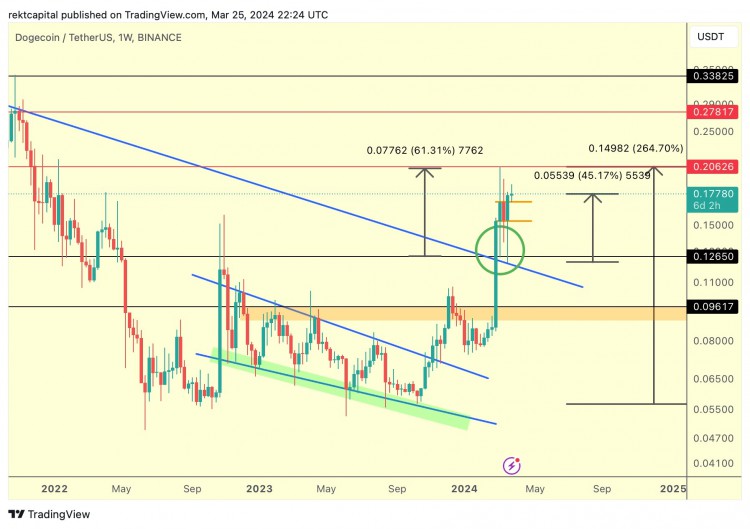
Additionally, Dogecoin may encounter resistance areas at various key price levels. These are crucial as they mark previous important trading points. The highest resistance level is around $0.33825. Below this, other levels are $0.27817 and $0.20626, among others. These points are of historical significance and may represent conflicts between buyers and sellers in the past.
A break above the downtrend line signals long-term bearish momentum and indicates a possible shift in market dynamics. The chart presented by Rekt Capital highlights this line, which crossed several peaks before breaking out. The bullish strategy is circled, highlighting its importance. This could indicate growing buying interest and a change in investor sentiment towards Dogecoin.
Additionally, the chart shows weekly candlesticks that represent price movements. The recent candle has a distinct green tint, indicating strong bullish momentum. These notes, including arrows and circles, are intended to highlight key market actions and analyst expectations for Dogecoin’s path forward.
However, according to the latest update from CoinMarketCap, Dogecoin is trading at $0.180726, up 4.30% in the past 24 hours at press time. Despite the rise, it remains below established resistance levels.
Therefore, this breakout and the bullish indicators that follow it could set the stage for further gains. Market participants now view these resistance zones as potential hurdles that, if breached, could catalyze further gains for Dogecoin.